

A gamma squeeze is a powerful example of strong positive market sentiment. Like short squeezes cause significant pain for short sellers of stock, gamma squeezes cause considerable pain to short sellers of call stock options.
A gamma squeeze occurs when positive market sentiment in a stock (the underlying, or root) brings in more buyers, especially buyers who buy calls to leverage their trade. The upward price spiral forces market makers to buy more of the stock to hedge their short call positions. The upward price spiral attracts more buyers of calls, which forces market makers to buy even more of the stock to maintain their hedge position. The climax to a powerful gamma squeeze is swift, with the peak lasting only an hour or so.
Market makers prefer to maintain a “delta neutral” over their positions in single assets. This means that each position is neutral with respect to price changes in the asset. Delta is simply the measure of sensitivity of the position to a price change in the asset. For a simple long position in a stock, delta is always one, or 1:1, meaning that a one dollar change in the stock share price generates an equal one dollar change per share in the price of the asset holding.
In contrast to simple stock ownership with its fixed 1:1 delta ratio, options have variable delta ratios. For a call far OTM, delta is very near zero and changes slowly. For a call far ITM, delta is very near one and changes slowly. For a call ATM, delta is 0.5 and changes rapidly.
Delta measures velocity–the change in the option value vs. the change in the underlying asset value.Gamma measures velocity of delta itself, which is the acceleration of the change in option value vs. the change in the underlying asset. When delta is far ITM or OTM, its value is stable at one for OTM and zero for ITM, then gamma is near zero.
24/06/24
NVDA long option holders suffered through a gamma squeeze during the week ending Friday, Jun 21, 2024, a triple-witching Friday at Q2 EOQ. A gamma squeeze is the equivalent of a short squeeze for traders who sell stock short. It is sometimes called an option wall or a pin.
The way to get delta positive is to buy the stock itself. Owning a stock is delta positive, because the stock position moves 1:1 with the stock price. if the stock price goes up $1, the stock position increases exactly $1 / share held. So a rising stock price forces professional traders to buy the stock, which drives the price up further. Gamma is the name for acceleration of a stock price. If the stock price begins to accelerate upwards (gamma positive), then professional traders will be caught in a gamma squeeze. When they buy stock to reduce their negative delta, the stock purchase drives up the stock price even faster, thus driving their position further delta negative. Ouch. They cannot get back to delta neutral by buying more stock.
The Set-Up
A gamma squeeze requires several events to occur in the same time range:
- Over a few months, professional traders amass a considerable amount of short calls in the stock.
- The share count in the short calls must be a significant percentage of the daily float, greater than 10% and enough to move the stock price if liquidated in a few days.
- The short calls must be clustered around a narrow price range, with expiry dates within a few weeks, preferably on the same Friday. Usually this will be the third Friday of the month, which is the monthly expiration date.
- The stock must develop strong momentum, or upward price trend. Often a stock can develop a retail following and become a meme stock, or develop a small bubble.
These signals are quantitative, and can be measured:
- Short call volume on 2-3 consecutive Friday expiry dates > 10% of daily trading volume, or float.
- Short call volume clustered around strike prices +5-+15% above the trading price.
- Stock has strong upward momentum, > 2% / week.
- Put/call ratio heavily skewed toward calls (ratio > 2.5:1)
- High, positive delta (stock price momentum)
- High, positive gamma (delta sensitivity)
For the gamma squeeze in NVDA on Jun 21, 2024, the statistics were:
- Total short call volume for expiry dates June 21, June 28, and July 4 was approx. 550 M shares.
- Short calls strikes clustered between $130-$140, when stock price was approx. $100 on June 6.
- NVDA stock price had already grown 100% in the first five months of the year.
The Gamma Squeeze Climax
Usually the Friday with the biggest short call volume will be the third Friday, which is the monthly expiry date. In the week of the expiry with biggest short call volume (open interest), the stock price rises into the target price range, thus flipping some option contracts into the money. Traders holding the call options, typically retail traders, begin to exercise their options, thus creating trades at the higher end of the strike price range. This flips more options into the money (ITM), which drives the price even higher on an accelerating curve.
Once the retail traders exercise their options to buy, they typically sell the stock immediately to realize their gains and reduce funds borrowed to buy the stock. This creates downward pressure on the price and the retail traders who exercised and held on to the stock see their gains quickly reduced or even wiped out. On the stock price chart, this creates a distinct spike at the high end of the price cluster. The price chart for NVDA shows this spike clearly on Thursday morning. Its price spiked to $140 almost immediately after the open, then quickly fell back to $130. SMCI, HPE, CLS and other AI companies tend to follow NVDA, so their price charts all exhibit the same spike around the same time frame.
Profitable Plays for Gamma Squeezes
- Sell a put well before the climax Friday. Close the short put trade on Wednesday or Thursday before climax Friday. Set a buyback price (60 day) below the climax price, because the spike may be very fast. The spike for this trade occurred from 9:30 to 10:30 on Thursday morning.
- Just before the peak, sell a call. Here again, you may want to make a 60 day offer at your expected price. Close the call trade early in the next week, or even later on climax Friday.
- Find stocks correlated with the gamma squeeze company. Do the same trades with them.
The NVDA Gamma Squeeze – Close-Up View
NVDA has been a rocket for this entire year. Also, it split 10:1 on June 8, thus creating more upward price pressure. The price peaked at $139.95, almost exactly at the highest strike price of $140. The spike occurred on Thursday morning, within 32 hours of the biggest expiry date. The climax occurred early because savvy traders know the window to exercise the option and sell at a high price is pretty small. They want to be first, so they jump the gun just a little. Selling NVDA at the peak of the gamma squeeze quickly becomes a crowded trade, with only the earliest/fastest traders winning a big prize.
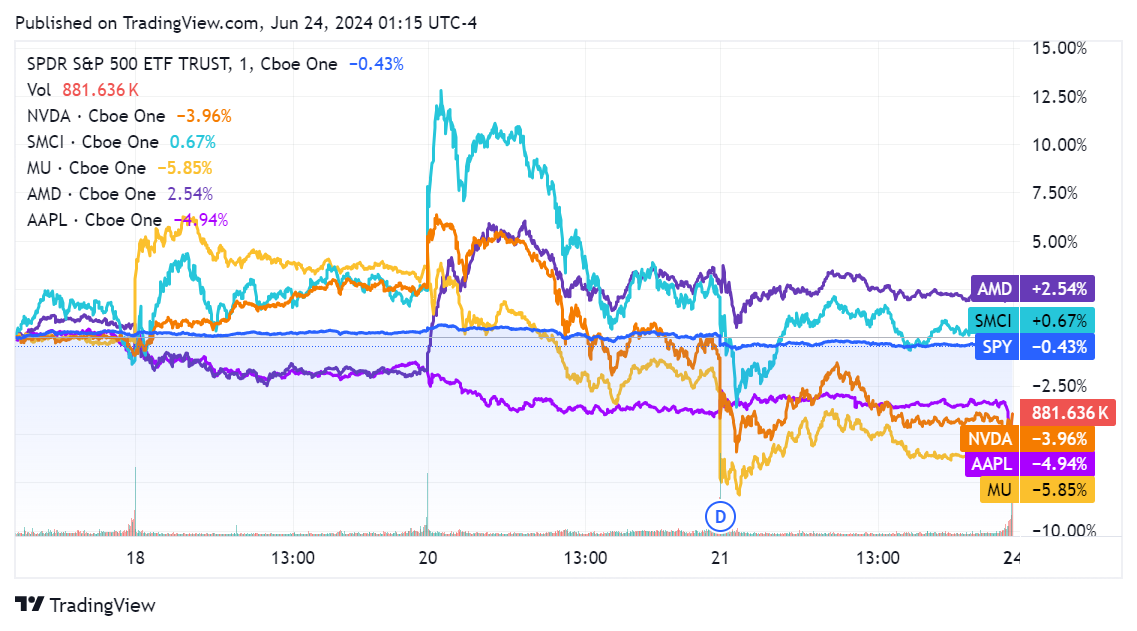
The price chart below compares prices for NVDA, MU, SMCI, SPY and AAPL from Monday, June 17 through Friday, June 21, which was the triple-witching expiry day with the big NVDA option wall, or pin between $130 and $140 strikes. Note the semi stock prices had no significant correlation before Thursday morning, June 20.
The semiconductor stocks all showed big spikes on Thursday morning, June 20. These stocks traded in tandem throughout Thursday and Friday. Likely the big spike in NVDA on Thursday morning was the gamma squeeze spike, when many options at $140 were called. In fact, the peak of the NVDA spike was $139.95, around 10:45 AM. A chart of option open interest (OI) for NVDA at 10 minute bars throughout the week may show a sudden drop in OI on Thursday morning. This would confirm the gamma squeeze spike. A decline in the put/call ratio after the price spike would further confirm the gamma squeeze spike, as would a decline in the ratio of call OI to daily trading volume.
Traders who created profits by calling options in the $130 – $140 strike range on Thursday quickly tried to cash out and collect their profits, which drove the price down. This price decline removed the pressure on professional traders, who no longer needed to buy NVDA to maintain delta neutrality. With supply now exceeding demand, NVDA stock price slumped on Thursday and dropped quickly at the open on Friday. A few retail investors jumped back in on Friday morning, hoping for a bargain price on NVDA but selling pressure from retail investors taking profits and the sudden decline in buying pressure by professional traders simply overwhelmed the weak rally.
Gamma Squeeze – Wider View
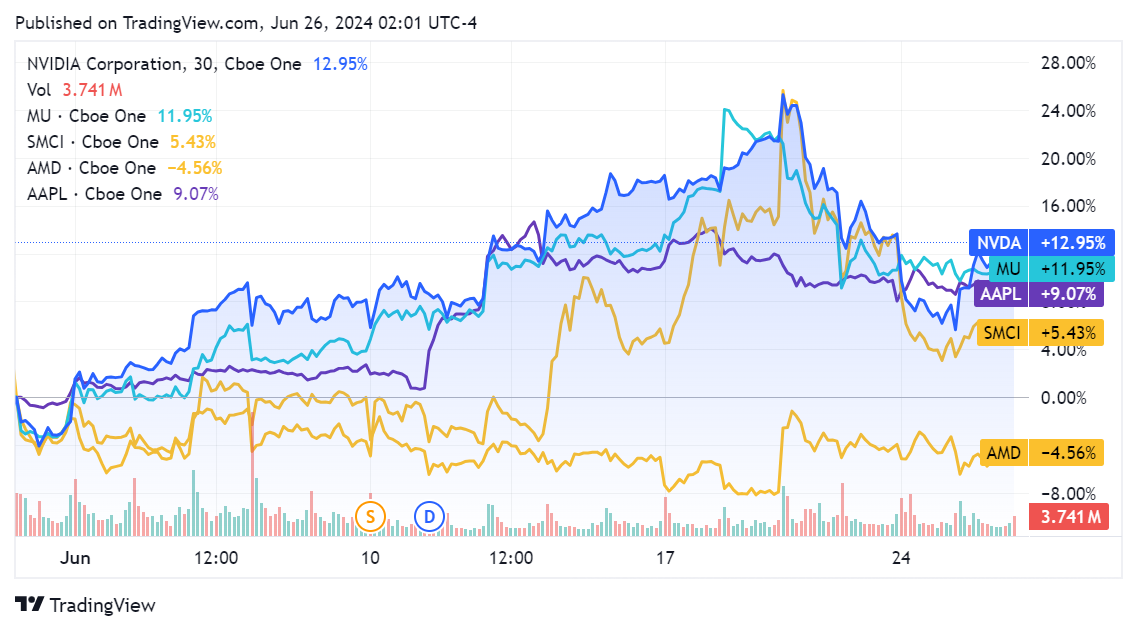
This chart shows the stock prices for the same companies, from May 31 through June 25, 2024. Note the tight correlation between NVDA and SMCI throughout June 20 – 22.
Trading Gamma Squeeze Spikes: Big Risks and Big Rewards
If this spike is typical, it illustrates several challenges in trading around a gamma squeeze:
- The squeeze spike occurred around 10 AM Thursday, almost two full trading days before the expiry date on 4 PM Friday.
- SMCI spiked about 12% within one hour around 10 AM Thursday, gave it all back within two hours and dropped another 10% over the next day. SMCI closed up 5.4% for this period.
- NVDA started a strong climb around June 5, adding 20% before the spike, which added another 4% within an hour, then gave away 12%, closing up 12% for the period at 4PM on Friday.
- Successful traders placed their trades earlier, around June 1 or earlier. They sold into the up-leg of the spike.
These charts illustrate the opportunity, the challenges, and the considerable risks of finding, then trading gamma squeezes. We believe gamma squeezes offer significant opportunites to trade options with high volatility, short duration, and lower risk. While squeezes have many similarities, predicting specific short-term price movements is extremely difficult and a mistake will be costly. Contact PowerMax if this looks interesting to you.